//
Subscribe to the Tabnine newsletter
//
Get news and updates about AI, software development, and more.
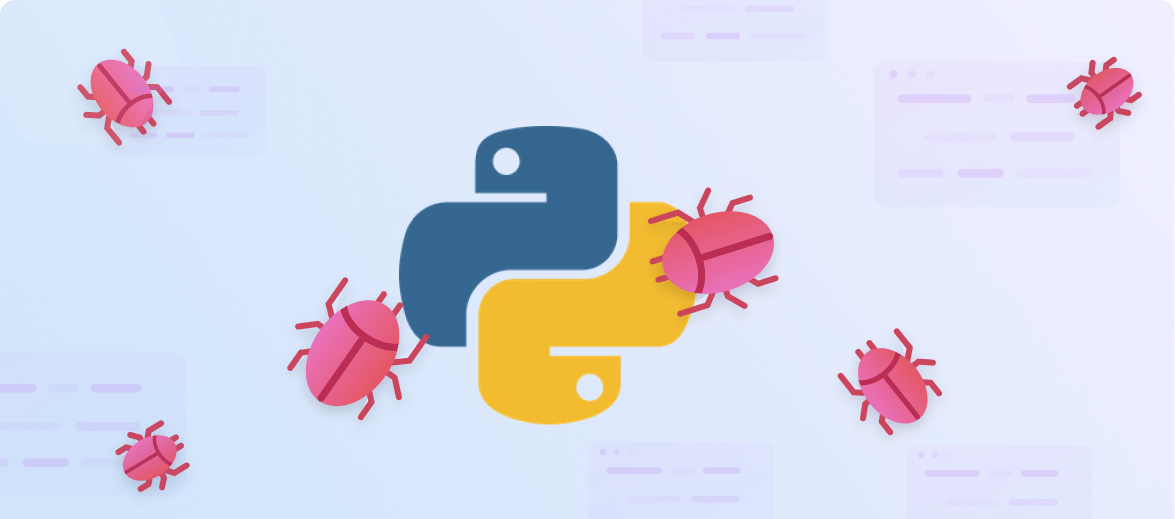
Debugging is a crucial aspect of Python programming that involves identifying and resolving errors or anomalies in your code. This article covers common types of errors you may encounter, such as syntax, runtime, and logical errors, along with more complex issues like performance bottlenecks and dependency problems.
We’ll also explore the main Python debugging tools available, from built-in debuggers to visual debuggers in IDEs and profiling tools. Lastly, the article outlines best practices to make your debugging process more efficient and effective. Armed with this knowledge, you’ll be better equipped to diagnose and fix problems in your Python programs.
This is part of a series of articles about Code Debugging.
Syntax errors are mistakes in your code that prevent your program from running correctly. Syntax errors usually occur when you violate the rules of the Python programming language.
For example, forgetting to close a parenthesis, or not correctly indenting your code, can lead to syntax errors. With Python code debugging, you can easily identify these errors and correct them. The Python interpreter points out where it got confused while trying to parse your code, making it easier for you to fix the issue.
Runtime errors occur after your program has started running. They can be caused by issues like division by zero, file not found, out of memory errors, and more.
Debugging runtime errors can be a bit tricky since your code will often appear fine at first glance. However, with debugging tools, you can step through your code, examining the values of variables at various points, and identify where the problem lies.
Logical errors occur when your program runs without crashing, but it doesn’t produce the correct result. This is usually due to a flaw in your program’s logic.
For example, you might have written an algorithm that’s supposed to sort a list of numbers in ascending order, but instead, it sorts them in descending order. By debugging your Python code, you can identify the logic flaw and correct it, ensuring your program produces the right result.
Performance bottlenecks occur when a particular part of your code slows down the overall performance of your software. These bottlenecks can be due to inefficient algorithms, memory usage issues, or other problems.
Debugging these issues involves identifying the slow parts of your code and finding ways to improve their performance. With Python code debugging, you can use profiling tools to measure the execution time of different parts of your code, helping you identify and eliminate any performance bottlenecks.
Dependency problems occur when your Python program relies on a particular library or module that is missing, outdated, or incompatible. These issues can be difficult to diagnose since the problem lies outside of your actual code.
However, Python’s debugging tools can help you identify these dependency issues. By stepping through your code and examining the output, you can find where the dependency issue is occurring and take steps to resolve it.
Related content: Read our guide to C Code Debugging.
There are several types of tools at your disposal for Python debugging:
Python comes with its built-in debugger, known as pdb. When you encounter an error in your code, pdb allows you to pause your program, look at the values of variables, and monitor the program execution step-by-step. This debugger provides a range of functionalities, right from setting conditional breakpoints, to inspecting stack frames. Learn more in the official documentation.
Visual debuggers in Integrated Development Environments (IDEs) provide an interactive user interface for debugging your Python code. These tools offer a more visual and intuitive debugging experience.
PyCharm, Visual Studio Code, and Eclipse PyDev are popular IDEs that come with robust debugging tools. They allow you to set breakpoints, step through your code, inspect variables, and visualize complex structures in a user-friendly manner. Some IDEs also provide visual debugging features or extensions, which can help you visualize complex code structures and understand where the problem lies.
Profiling tools are another great asset for Python code debugging. They help you identify performance bottlenecks in your code by providing detailed statistics about the execution time of different parts of your program. Tools like cProfile and Profile provide deterministic profiling of Python programs. They can generate reports that help you understand the runtime behavior of your programs and optimize them for better performance.
Learn more in our detailed guide to VS Code Debugging.
Recent advances in generative AI make it possible to fully automate debugging tasks in Python and other languages. AI coding assistants like Tabnine can predict and generate code completions in real time, and can provide automated debugging suggestions, which are sensitive to the context of your software project.
Tabnine integrates with the common Python IDEs. As you type in your IDE, Tabnine analyzes the code and comments, predicting the most likely next steps and offering them as suggestions for you to accept or reject.
Tabnine utilizes a Large Language Model (LLM) trained on reputable open source code with permissive licenses, StackOverflow Q&A, and even your entire codebase (Enterprise feature). This means it generates more relevant, higher quality, more secure code than other tools on the market.
Tabnine is the AI coding assistant that helps development teams of every size use AI to accelerate and simplify the software development process without sacrificing privacy, security, or compliance. Tabnine boosts engineering velocity, code quality, and developer happiness by automating the coding workflow through AI tools customized to your team. Tabnine supports more than one million developers across companies in every industry.
Unlike generic coding assistants, Tabnine is the AI that you control:
It’s private. You choose where and how to deploy Tabnine (SaaS, VPC, or on-premises) to maximize control over your intellectual property. Rest easy knowing that Tabnine never stores or shares your company’s code.
It’s personalized. Tabnine delivers an optimized experience for each development team. It’s context-aware and can be tuned to recommend based on your standards. You can also create a bespoke model trained on your codebases.
It’s protected. Tabnine is built with enterprise-grade security and compliance at its core. It’s trained exclusively on open source code with permissive licenses, ensuring that our customers are never exposed to legal liability.
Read more about AI for software development in our guide for AI coding tools.
Now that you’re familiar with the tools, let’s look at some best practices to follow while debugging your Python code.
Before diving into debugging, form a clear hypothesis about what might be causing the issue. This involves understanding the error message, identifying the code area where the problem might be, and predicting the behavior that’s causing the problem. Having a clear hypothesis helps you focus your debugging efforts efficiently and saves time.
The next step in Python code debugging is to isolate the problematic code. This involves reducing your code to the minimum possible set that still reproduces the issue. This process of isolation helps to eliminate any external factors that might be affecting the outcome, allowing you to focus solely on the problem at hand.
Post-mortem debugging is a powerful technique that allows you to inspect the state of your program at the point of an exception. Python’s pdb provides a post-mortem debugging mode where you can inspect variables, look at the call stack, and understand what led to the exception. This can provide valuable insights into the root cause of the error.
Debugging is a fundamental skill for Python programmers. This article has covered various types of errors, from syntax and runtime to logical errors, as well as performance bottlenecks and dependency problems. We’ve also discussed the range of tools available for Python debugging, such as pdb, Python’s built-in debugger, IDE-based debugging tools, profiling tools, and even AI coding assistants. Finally, best practices like forming a clear hypothesis, isolating the issue, and using post-mortem debugging can streamline the debugging process.
Understanding these elements equips you to more effectively identify problems, evaluate the state of your code, and implement solutions. Debugging is not just about fixing immediate issues; it’s also about gaining deeper insights into how your code operates and taking your Python programs to the next level.

Explore recent posts
//Explore recent posts
//
2 -min read

3 -min read
3 -min read
More How-to's
//5 -min read
4 -min read
4 -min read